BlackBox, the lightweight logging project
When it comes to a software project that's going to see a lot of traffic, one of the major considerations (or at least it should be anyway), is log aggregation, observability and traceability, aka the ability to see what's going on in your application/system, where things are going wrong, and how they can be reproduced.
Now, it's no secret that's there's a ton of tools out there for this. Datadog and Sentry are huge in the managed cloud space, and you've got the prometheus stack for more self managed systems (particularly in Kubernetes clusters and the likes). They're great tools, but they have the problem of either being costly (for example; data egress costs, licensing, or infrastructure overhead), and to be honest, I wanted a challenge.
I had a few of objectives for this project:
- Try to implement near real time log observability
- Integrate with my existing (wider scoped) application architecture
- Make use of Log4j2 - after all, I want to be able to use this in other projects
- Provide a simple interface for querying and sorting logs.
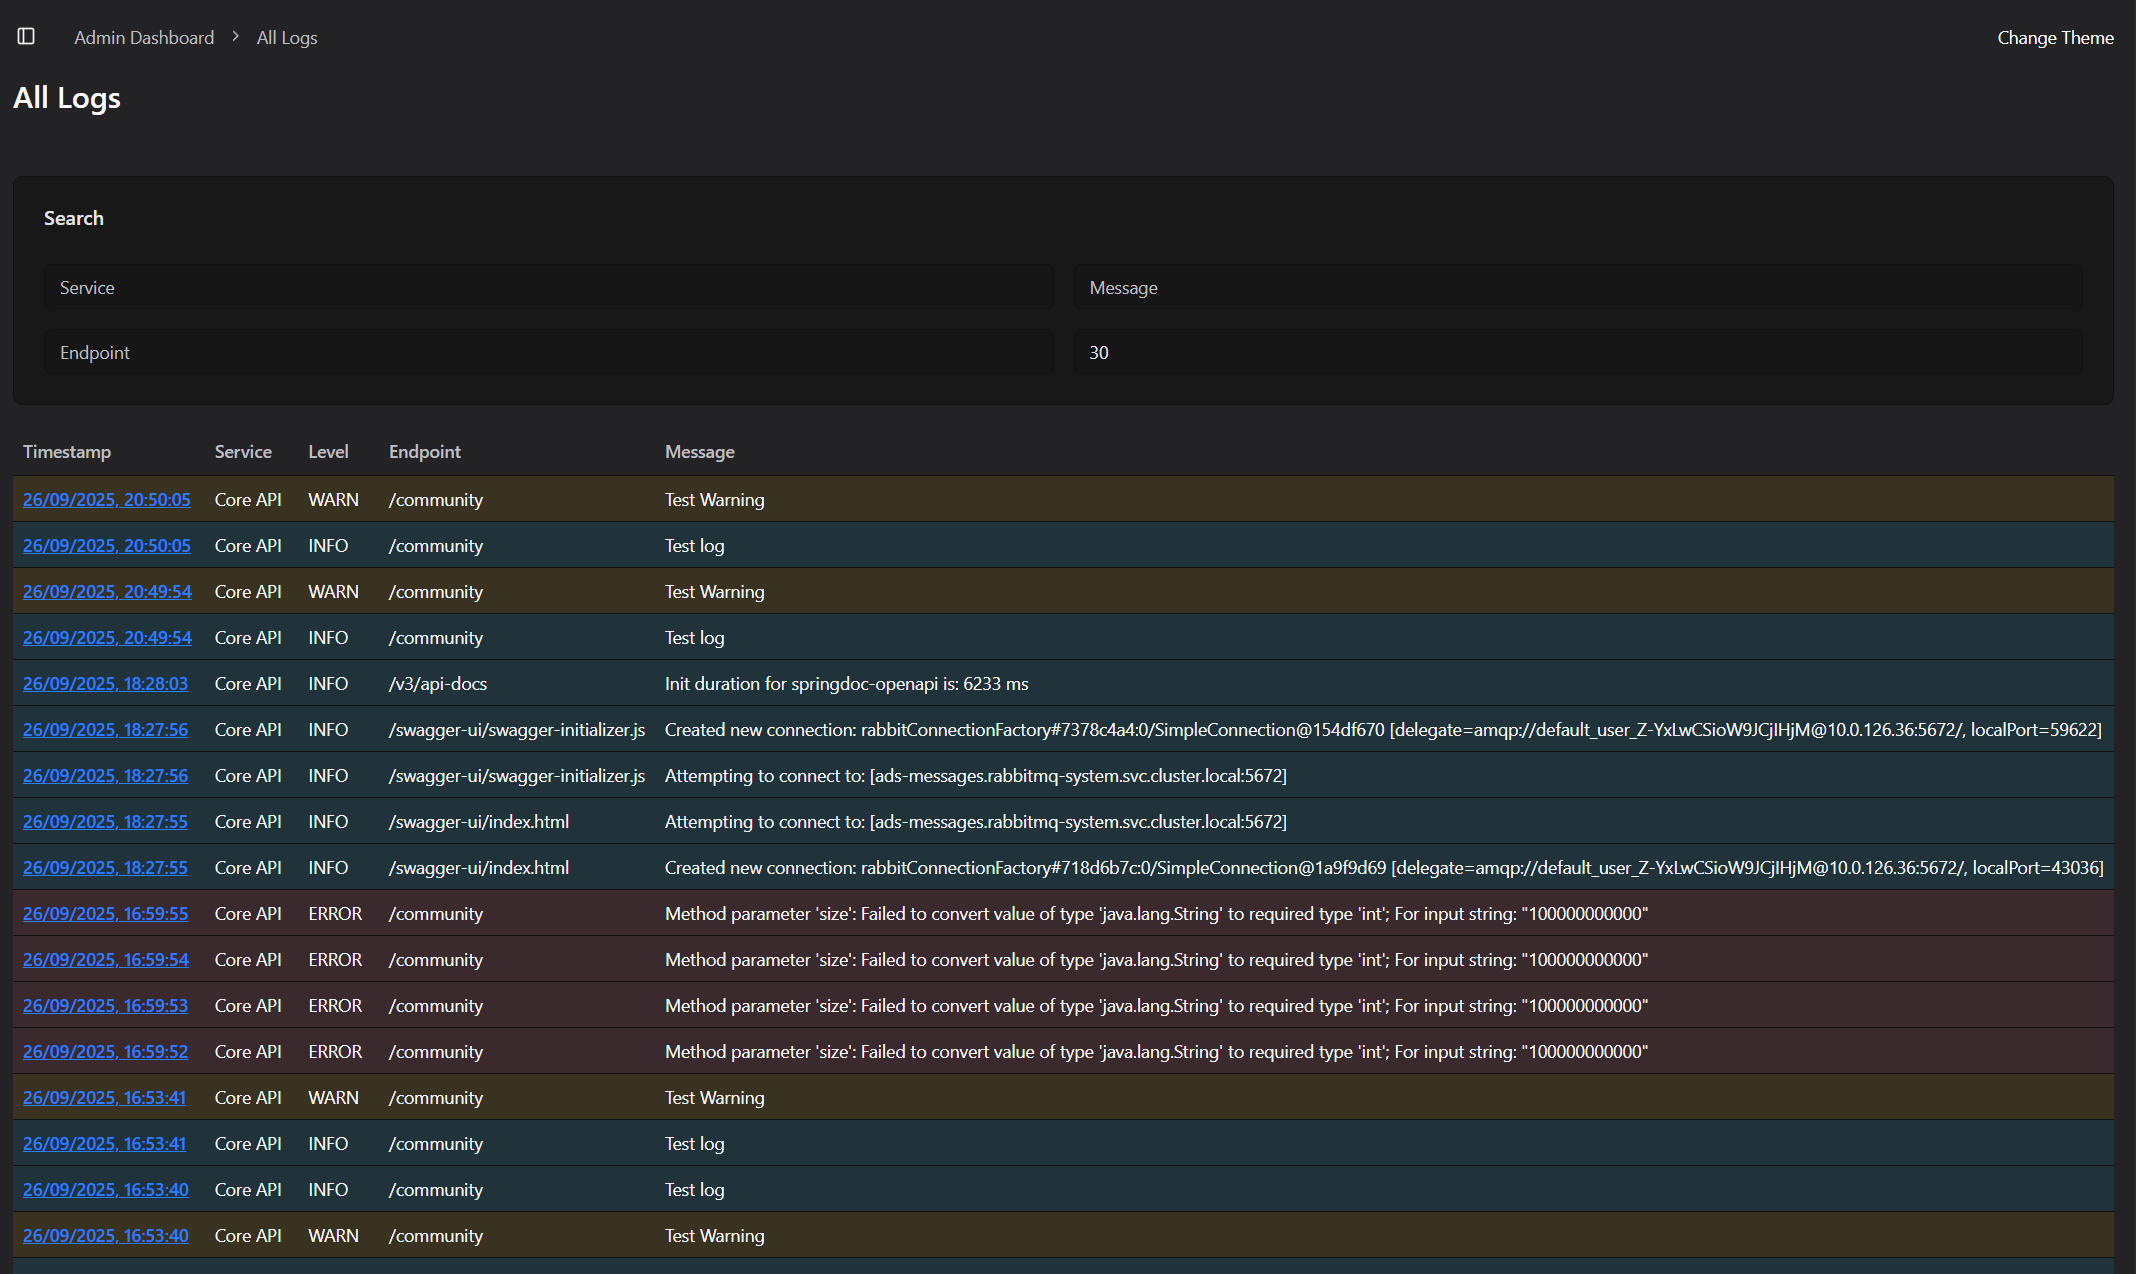
Below is a small screenshot snippet of the UI I've built around this, just highlighting the typical log levels:
Understanding the architecture
So in the context of my larger project that BlackBox was being built for, I was deploying a number of services on a Kubernetes Cluster, including 2 Spring Boot applications, 2 Nuxt 4 UI applications, all linked together using a RabbitMQ cluster.
Currently a lot of data is passed between pods using RabbitMQ, for example notifications being sent from an API service to a Notifications service, or a connection log from the Nuxt applications to an API service. I wanted to make use of this functionality for my BlackBox service -> sending log information from the Nuxt and Spring applications over RabbitMQ, to be aggregated and stored in BlackBox.
While this isn't strictly best practices, I wanted to experiment with this implementation, and with the goal of near real time aggregation, this suited me quite well.
Datastructures
So, here's what the typical logs look like as structured JSON (roughly anyway). Firstly, an error log, specifically a RuntimeException in the Java world.
{
    "id": 31,
    "createdAt": 1758902395.000000000,
    "updatedAt": 1758902395.000000000,
    "createdBy": KeycloakUserRepresentation,
    "updatedBy": KeycloakUserRepresentation,
    "type": "ERROR",
    "service": "Core API",
    "message": "Sample Error Message",
    "uniqueId": "d0a02bf4-42d8-4a79-a800-3fa5901535c4",
    "endpoint": "/my-test-endpoint",
    "trace": [
        "java stack trace"
    ],
    "timestamp": 1758902395.000000000
}
This would be my ideal structure for collecting log information, generated by a Log4j2 appender (more on this later). The createdBy & updatedBy fields would reference users in my application's Keycloak implementation, so we can see who exactly triggered the logs in the context of an HTTP request, endpoint so we can see WHERE the log is coming from (I often find this more helpful than just a class name or method name, though these could be added), the trace is for when exceptions are thrown/errors logged (always handy), and lastly, a uniqueId so that we can tie these into HTTP requests.
Now I also wanted to collect logs on incoming HTTP requests, i.e. who's making requests, what their client address is, their Keycloak ID, request payload, and response body. These are all bits of information that I found incredibly helpful in the debugging process:
{
    "id": 493,
    "createdAt": 1758902020.000000000,
    "updatedAt": 1758902020.000000000,
    "createdBy": KeycloakUserRepresentation,
    "updatedBy": null,
    "timestamp": 1758902020.000000000,
    "service": "Core API",
    "endpoint": "/my-test-endpoint",
    "status": 200,
    "clientIp": "IP Address",
    "uniqueId": "d0a02bf4-42d8-4a79-a800-3fa5901535c4",
    "latitude": 0,
    "longitude": 0,
    "city": "Belfast",
    "country": "United Kingdom",
    "countryIso": "GB",
    "query": null,
    "response": {}, // parsed json body
    "request": {} // parsed query params
    },
Implementing into Spring Boot
So without spoiling all the fun, there was 2 key areas I had to implement the Spring Boot logging into. The first, and most important (for me anyway), was in the ExceptionController. Just a simple class used to handle the various exceptions thrown during the app's life cycle. Consider this a "fallback" for all 500 Internal Server Errors:
@ExceptionHandler(RuntimeException.class)
public ResponseEntity<ErrorResource> handleRuntimeException(RuntimeException exception, WebRequest request) {
    ErrorResource errorResource = new ErrorResource();
    errorResource.setMessage("There's been an error on our end. We've logged this issue and will look into it!");
    errorResource.setHttpStatus(HttpStatus.INTERNAL_SERVER_ERROR);
    errorResource.setTimestamp(new Date());
    errorResource.setPath(request.getDescription(false).replace("uri=", ""));
    Map<String, Object> logPayload = new HashMap<>();
    logPayload.put("userIp", request.getHeader("x-real-ip"));
    logPayload.put("message", exception.getMessage());
    logPayload.put("trace", Arrays.toString(exception.getStackTrace()));
    logPayload.put("path", request.getDescription(false).replace("uri=", ""));
    String uniqueId = (String) ((ServletWebRequest) request).getRequest().getAttribute("uniqueId");
    logPayload.put("uniqueId", uniqueId);
    if(request.getUserPrincipal() != null && request.getUserPrincipal().getName() != null)
        logPayload.put("keycloakUser", request.getUserPrincipal().getName());
    LogMessage message = LogMessage.builder()
            .type(LogType.ERROR)
            .service("Core API")
            .timestamp(Instant.now())
            .data(logPayload)
            .build();
    messageService.sendLog(message);
    return new ResponseEntity<>(errorResource, HttpStatus.INTERNAL_SERVER_ERROR);
}
Nothing too crazy here; if anything it's a little rudimentary, but it works. Take the incoming exception, build a log message, send it to RabbitMQ and return a generic 500 error.
Then, the next most important section, the HTTP Request filtering. I decided to take the approach of a Spring Boot filter. I wanted to make sure I was capturing and saving both the request and the response, without adding significant overhead to the response times. This is the approach I took:
@Override
protected void doFilterInternal(HttpServletRequest request, HttpServletResponse response, FilterChain filterChain)
        throws ServletException, IOException {
    ContentCachingRequestWrapper wrappedRequest = new ContentCachingRequestWrapper(request);
    ContentCachingResponseWrapper wrappedResponse = new ContentCachingResponseWrapper(response);
    String uniqueId = UUID.randomUUID().toString();
    request.setAttribute("uniqueId", uniqueId);
    ThreadContext.put("uniqueId", uniqueId);
    ThreadContext.put("userIp", request.getHeader("x-real-ip"));
    ThreadContext.put("endpoint", wrappedRequest.getRequestURI());
    if(request.getUserPrincipal() != null && request.getUserPrincipal().getName() != null)
        ThreadContext.put("keycloakUser", request.getUserPrincipal().getName());
    long startTime = System.currentTimeMillis();
    try {
        filterChain.doFilter(wrappedRequest, wrappedResponse);
    } finally {
        String userIp = wrappedRequest.getHeader("x-real-ip");
        String endpoint = wrappedRequest.getRequestURI();
        if(endpoint.contains("/actuator")) {
            wrappedResponse.copyBodyToResponse();
            return;
        }
        String queryParams = wrappedRequest.getQueryString();
        String encoding = Optional.ofNullable(request.getCharacterEncoding()).orElse(StandardCharsets.UTF_8.name());
        String requestBody = new String(wrappedRequest.getContentAsByteArray(), encoding);
        String responseBody = new String(wrappedResponse.getContentAsByteArray(), encoding);
        int statusCode = wrappedResponse.getStatus();

        Map<String, Object> logData = new HashMap<>();
        //Assemble log data
        long duration = System.currentTimeMillis() - startTime;
        logData.put("responseTime", duration);
        if(this.enabled) {
            messageService.sendLog(logMessage); // Only log if it's actually enabled - don't want to introduce extra noise
        }
        wrappedResponse.copyBodyToResponse();
    }
}
Now of course, there's the implementation into your favourite logging system, whether that's the shipped logback implementation, Log4j2 or whatever else, but those can be added relatively simply, depending on the library. If you're curious about the specific implementation of my RabbitMQ Appender class for Log4j2, reach out!
Processing & Storage
So, we've covered how to get the logs to BlackBox, but not actually what we're doing with them. The crux of it is setting up a RabbitMQ listener, then doing the necessary type conversion and persisting of data.
The current implementation in my system is built on Spring Boot (for simplicity's sake), with a MySQL database. Obviously over a longer term, database storage for vast numbers of logs is not only inefficient, but costly as well, and one of the key reasons for this adventure was to keep things cheap. Ideally what I'd like to have is a defined "retention" period, something like 60 days, then logs older than that are chucked out into JSON files and persisted in some form of cheap archival storage (think AWS S3 Glacier, or that dusty NAS in the closet).
In terms of the incoming logs, we handle them pretty simply:
@RabbitListener(queues = "logs")
public void processMessage(String content) {
    IncomingLogResource message = null;
    try {
        message = objectMapper.readValue(content, IncomingLogResource.class);
        if (message.getType().equals(LogType.REQUEST)) {
            HttpRequestLogResource log = httpRequestLogService.convertAndSave(message);
            messagingTemplate.convertAndSend("/ws/live-requests", log);
        } else {
            LogMessageResource log = logMessageService.convertAndSave(message);
            if(log.getType().equals(LogType.ERROR)) {
                messagingTemplate.convertAndSend("/ws/live-errors", log);
                SystemErrorNotification systemError = new SystemErrorNotification(this.messageService, blackBoxConfig);
                systemError.toSystem(log);
            }
        }
    } catch (JsonProcessingException e) {
        throw new RuntimeException(e);
    }
}
Now, one of the requirements here was near real time, and the secret is within that convertAndSend method, where I defined a websocket URL. The specifics of the implementation aren't important, but it's your standard websocket system, so that any actively connected users will get instantly notified of requests and errors. I also have a defined SystemErrorNotification, this really just sends a slack message to let us know what's gone wrong - it beats an email that gets missed or ignored.
Conclusion
This was a bit of a lengthier piece, and I've skipped a lot of detail, but it's time to ask the important question; was it worth it? Honestly, yes. This does have some genuine use already, it helps debugging issues in production substantially easier. Rather than trying to get a user, or QA to replicate an issue with guess work, you can see exactly the data being passed in to cause issues etc, which is a huge time saver. Also you have the added bonus of being able to keep data inside your private network, another added bonus for data protection and security. There are of course the downsides. The biggest was the time it took to build this I could've used on other projects, but besides that, the cost of storage can't be ignored. This also doesn't track node/server metrics, but this could be easily expanded to handle metrics like that. You also have the dependency on RabbitMQ, if I was to productionise this, I'd like to take the approach of linking into the pod logging API within Kubernetes for enhanced robustness.